A visitor finds your SaaS through a comparison page, reads your pricing page and starts a trial. Then they create a project, invite a teammate and return three days later.
That looks like one customer journey. In analytics, however, it contains two different sets of questions:
- Web analytics: Where did the visitor come from? Which landing page and campaign led to the signup? Where did people leave the signup flow?
- Product analytics: Did the new account reach its activation milestone? Which features did it use? Did it return in week two? Do invited teams retain better than solo users?
The difference is not simply “website data” versus “app data.” Both types of tools can track pages, events and funnels. The more useful distinction is the decision you are trying to make and the level of continuity the answer requires.
Web analytics is mostly used to improve acquisition, content and conversion. Product analytics is used to improve how people activate, adopt features and receive value from a product. The data needed depends on the question: a feature count is much simpler than a retention cohort that follows the same accounts for several months.
This guide explains where that line sits, where Plausible fits and when you should use a dedicated product analytics platform instead.
- What is web analytics?
- What is product analytics?
- Web analytics vs product analytics at a glance
- Where Plausible fits
- Where Plausible is not trying to compete with product analytics tools
- SaaS use cases Plausible does cover
- How to choose between web analytics, product analytics or both
What is web analytics?
Web analytics helps you understand how people find and use a website, and whether they complete the actions the website is designed to encourage.
It is best suited to questions such as:
- How much traffic did we get, and which sources sent it?
- Which search queries, referral sites and campaigns brought qualified visitors?
- Which landing pages attract traffic and lead to signups?
- How many visitors viewed pricing, started registration and completed it?
- Did the new homepage or campaign improve the conversion rate?
The core web analytics workflow is acquisition → engagement → conversion.
Acquisition reports cover referral sources, search, paid and organic campaigns, and UTM parameters. Content reports cover landing pages, popular pages, entry and exit pages, and engagement. Goals and funnels connect that activity to outcomes such as a demo request, newsletter subscription, trial signup or purchase.
This is useful beyond the marketing department. Founders, content teams and growth teams all need to know what brings the right audience to a site and what helps that audience convert.
What is product analytics?
Product analytics helps you understand how people use a software product and whether that experience delivers value. It can be as simple as counting uses of a feature or as involved as following the same users and accounts across days, weeks or months.
It is built for questions such as:
- What percentage of new accounts reaches the activation milestone?
- How often is a particular feature or workflow used?
- Did usage of a feature increase after a release?
- How long does activation take?
- Which onboarding steps predict successful adoption?
- Do people who use a particular feature retain better?
- What is the day 7, week 4 or month 3 retention rate?
- How does behavior differ by signup cohort, plan or account type?
The core product analytics workflow is activation → engagement → retention.
Questions about total feature usage or changes after a release may be answered with aggregate events and properties. Retention and behavioral cohorts require the events in the analysis to be associated with the same users over time. Product analytics platforms use user identifiers for this purpose; some also support separately configured group identifiers for account- or workspace-level analysis. A user profile is not always required simply to record events, but a consistent identifier is what lets the platform group people by actions they took and calculate whether they returned later.
Identity does not define product analytics. It becomes necessary for a particular class of questions: who did something, what else they did and whether they came back later. “Who” may mean a pseudonymous user, workspace or account rather than a named person.
Web analytics vs product analytics at a glance
| Web analytics | Product analytics | |
|---|---|---|
| Main question | How do people find and convert on our website? | How do users adopt and keep using our product? |
| Typical journey | First visit to conversion | Signup to activation, engagement and retention |
| Common units | Visitors, visits, pages and conversions | Events, users, accounts, features and cohorts |
| Common reports | Sources, campaigns, landing pages, goals and conversion funnels | Onboarding, feature adoption, behavioral cohorts and retention curves |
| Time horizon | Often a visit, campaign or reporting period | Often a user lifecycle across days or months |
| Typical owners | Marketing, content, growth and founders | Product, data and customer success teams |
| Identity requirements | Often works without recognizing returning visitors | Overall usage counts may not need identity; cohorts and retention usually do |
The categories overlap. A web analytics tool may support custom events and funnels. A product analytics tool may report acquisition sources and landing pages. The presence of an “events” or “funnels” feature does not settle which category a tool belongs to. What matters is whether you are trying to improve how people find and convert on a website or how they use and get value from a product.
Start instead with two questions:
- What are you trying to improve? Acquisition, content and website conversion usually point to web analytics. Activation, product engagement, feature adoption and retention point to product analytics.
- What continuity does the answer require? Counting uses of a feature is one thing. Building retention cohorts or tracing account journeys across sessions requires a stable user or account identifier.
The first question identifies the analytical job. The second identifies the data model and type of tool needed to do it.
Where Plausible fits
Plausible is a web analytics tool. It measures traffic and behavior without cookies, personal data or persistent identifiers. That focus does not prevent it from answering selected questions about product usage.
Its natural strengths are:
- Traffic acquisition and marketing attribution
- Pages, landing pages and content performance
- Referral sources, channels and UTM campaigns
- Goals, conversion rates and revenue attribution
- Custom events and properties
- Defined conversion funnels and open-ended user journeys
For a SaaS business, that covers the journey from a campaign, search result or referral through to a trial signup or another meaningful conversion. You can also send selected events from the product, such as Created Project or Invited Teammate, to measure their frequency or include them in a conversion funnel.
Plausible can therefore answer questions like:
- Which campaign drove the most trial signups?
- Which landing page visitors are most likely to create a project?
- Where do visitors drop out between pricing, signup and onboarding completion?
- Which plan or experiment variant has the higher conversion rate?
- How often was a feature used during a selected period?
Feature usage is a product analytics question that does not always need an individual history. Plausible can count a feature event and segment it using non-personal custom properties. It cannot tell you whether the people who used the feature in January returned in February.
That limitation follows directly from Plausible’s privacy model. A person who visits on different days may be counted as a different visitor because Plausible does not use a persistent identifier to recognize them. Do not send names, email addresses, account IDs, pseudonymous cookie IDs or other personal identifiers as custom properties.
Where Plausible is not trying to compete with product analytics tools
Tools like Amplitude and Mixpanel are event-based analytics platforms with reports for product questions such as funnels, behavioral cohorts and retention. In both tools, events can be associated with a user identifier so activity from the same user can be analyzed together. Their documentation also describes separate group-level features for analyzing companies, workspaces or other account-like entities; these require additional instrumentation and may depend on the product or plan.
Plausible overlaps with a portion of product analytics; it is not trying to reproduce that persistent behavioral model with a simpler interface. It does not provide:
- Persistent user profiles or separately configured account/group profiles
- Multi-day user-level histories
- Signup cohorts followed through later periods
- Retention curves such as day 1, day 7 or week 4 retention
- Comparing later retention for cohorts defined by earlier product behavior
- User-level feature adoption or frequency analysis
Suppose 500 people sign up in August. Plausible can answer “How many project-creation events happened in August?” It cannot answer “Of that August signup cohort, how many activated within seven days and were still active four weeks later?” The second question requires connecting each account’s signup, activation and return events over time. Plausible deliberately does not maintain that connection.
Plausible can instead tell you how many visitors completed a signup or activation event during August, the sources and campaigns associated with those conversions, and where visitors dropped out of a defined funnel. Those are useful answers, but they are not a retention cohort.
This is also why a “unique visitor” in web analytics should not be treated as a SaaS user count. Your billing system or product database is the source of truth for accounts, subscriptions and churn.
For a broader view of other use cases outside Plausible’s scope—including session replay, retargeting and user-level tracking—read when Plausible is not the right fit.
SaaS use cases Plausible does cover
The boundary does not mean Plausible stops being useful when someone clicks “Sign up.” Many SaaS teams need a focused set of product and growth signals without building a full user-level analytics system.
Signup funnels
You can combine pageview goals and custom event goals into a funnel such as:
- Viewed pricing
- Started signup
- Completed registration
- Created first project
Plausible shows how many visitors complete each step and the drop-off between them. You can filter the funnel by source, campaign, landing page, device, location or another available dimension to find where a particular segment struggles.
This works well for a defined conversion or onboarding path. It is not a substitute for following a signup cohort through a 30-day lifecycle. See the funnel analysis documentation for setup details and current limits.
Marketing attribution through to a meaningful conversion
A signup count alone can reward channels that bring a lot of low-intent traffic. A more useful setup sends a later milestone—such as Created Project, Booked Demo or Upgraded—as a goal.
You can then filter that goal by referral source, channel, UTM campaign or landing page. This answers questions such as “Which campaign brought visitors who reached activation?” without building profiles for those visitors.
Attribution has limits in any privacy-friendly system. Plausible is strongest when the journey happens within the same visitor session across your site and subdomains. It is not designed to stitch a person across devices or recognize a lead who returns weeks later from another browser.
Custom events and properties
Custom event goals let you measure actions that do not produce a distinct pageview: CTA clicks, form completions, video plays, project creation or any other event you choose to send.
Custom properties add non-personal context to a pageview or event. A SaaS team might attach:
plan=starterorplan=proto a signup eventrole=adminorrole=memberto a feature eventlogged_in=trueto separate public-site and in-product activityvariant=Aorvariant=Bto an experiment exposure or conversion
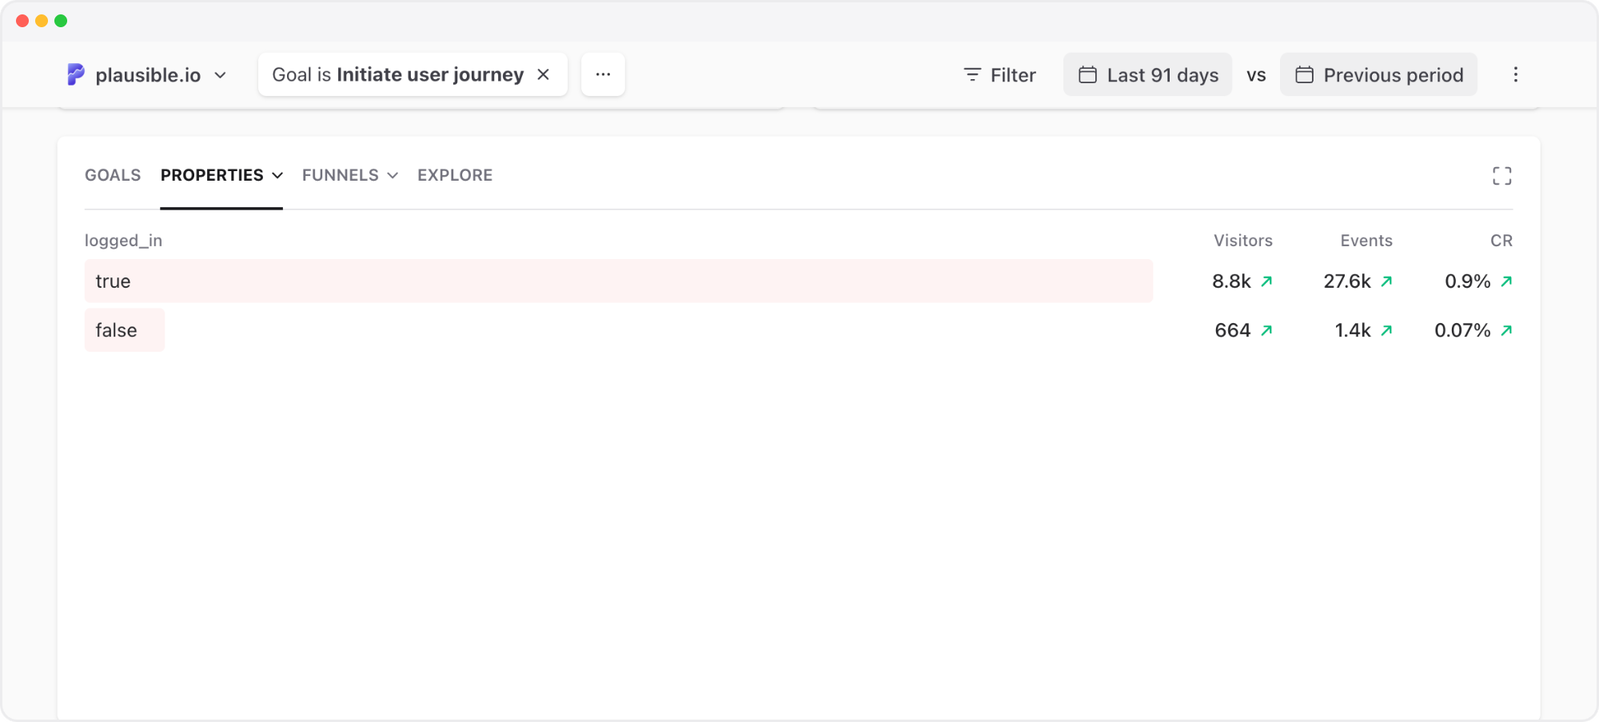
For example, you could attach logged_in=true or logged_in=false to a goal event. Plausible can then show the visitors, total events and conversion rate for each value. This helps you compare how the event is used in logged-in and logged-out contexts, but it does not create a history of what each logged-in user did before or after that event. You can explore this kind of property breakdown in our live demo.
Properties let you filter and compare behavior. They must not contain information that identifies or persistently singles out a person.
A/B test result tracking
Plausible can measure the outcome of a website A/B test. Send the assigned variant as a custom property, then compare goal completions and conversion rates for each variant.
Plausible does not split traffic, assign variants, manage feature flags or decide whether a result is statistically significant. You need your own code or an experimentation tool for those parts. Plausible measures the resulting visits and conversions.
Our guide to A/B testing a website explains the setup and the statistical cautions.
How to choose between web analytics, product analytics or both
Use web analytics when your main questions are about traffic, content, campaigns and conversion:
- Where are visitors coming from?
- Which pages and campaigns generate signups or revenue?
- Where does a short signup or checkout funnel lose people?
- Did a landing-page experiment improve conversion?
Use product analytics when your main questions are about activation, product engagement, feature adoption or retention:
- How often is a key feature or workflow used?
- Did overall usage change after a product release?
- Which signup cohorts retain after 30 or 90 days?
- How does retention differ between people who did or did not use a particular feature?
- How does feature adoption develop over a customer’s lifecycle?
- Which individual accounts have or have not reached an activation milestone?
The first two questions only require overall usage totals. The remaining questions need events to be linked to the same users or accounts, using a dedicated product analytics system or your own product data.
Use both when acquisition and product retention are both important enough to analyze deeply. This is common for a growing SaaS company: Plausible can provide a simple, privacy-friendly view of the marketing site and acquisition funnel, while Amplitude, Mixpanel or another product analytics system provides the linked event data needed for cohorts and retention.
The numbers from two tools may not match exactly because they use different identity models, time windows and definitions. That does not make either one automatically wrong. Define which system owns each metric: for example, Plausible for website visitors and campaign conversions, your application database for accounts and revenue, and a product analytics tool for cohorts and retention.
If your needs sit in the overlap, write down the exact question. “Can it track events?” is too broad. Ask instead:
- Do we need an event total or a history for each user?
- Is this a conversion funnel or a multi-week lifecycle?
- Do we need to compare traffic segments or behavioral cohorts?
- Is identifying the same account later essential to the answer?
Those questions make the choice much easier.
Plausible is built for teams that want clear answers about acquisition, website behavior and conversion without tracking people across the internet—or across months of product use. It can also measure selected activity inside a product. If that matches your needs, explore Plausible for SaaS or start a free 30-day trial. If you need retention cohorts or long-term user and account histories, choose a dedicated product analytics tool, whether or not you also use Plausible for your website.